Identifying the Optimal Subway Stations for Street Teams
by Kenneth Myers
Our first project at Metis was less of a data science assignment and more of a data analysis project (partly because we hadn’t learned much data science yet and partly to get us acquainted with some libraries like mplib, numpy and pandas). The goal was as follows:
Recommend to a tech company focused on getting women involved in tech is having a gala that they need to promote for. They come to you and ask you to find the best subway stations where their street team (those who advertise the event on the streets) should promote. The street team’s goal is to collect names and emails of people who would donate and/or come to a gala.
My group and I broke this prompt down into three parts:
- What are the best neighborhoods based on tech companies (likeliness to give) and average income (ability to give)?
- What are the most popular subway stations in these neighborhoods.
- What times are best to promote at those stations.
Best neighborhoods
First we needed to identify the best tech neighborhoods as well as the wealthiest. After some searching I found this report that listed the number of startups founded in different NYC zipcodes between 2007 and 2012. We obtained the incomes of NYC zipcodes from Zip Atlas. From this information, we created a weighted ranking system of the neighbor hoods according to the following equation:
rank = α⋅startup + (1-α)⋅income
Where α represents a number between 0 and 1 that is the clients preference for startup vs. income (in our case we used 0.5, equal weighting).
You can click on the maps below to see the top 10 zip codes by income and tech startups.
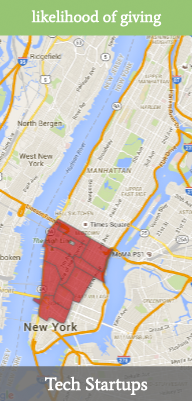
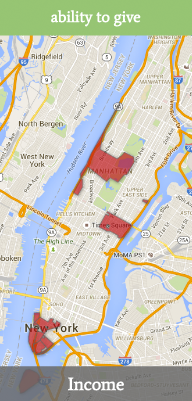
You can see that there is no overlap between these areas. Tech locations turn out to not be where the wealthiest people live. So our next step was to identify the subway stations with the most foot traffic and see which of these zip codes they land in.
Best Subway Stations
As it turns out, the MTA supplies information on turnstile traffic. We decided to use ingoing traffic exclusively as the outgoing traffic wouldn’t be accurate (due to people leaving through the emergency exit). Unfortunately MTA doesn’t supply the zipcodes of these stations so we had to merge that data with someone else’s.
What we found was that the top ten entries tended to have good overlap with tech neighborhoods. You can see from the map below that the top 5 subway stations are in the zip codes 10010 and 10003.
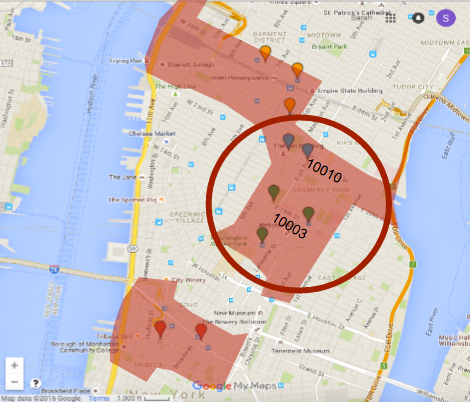
We now had a minimum recommendation for where the street team should be promoting. But how about the best times?
Peak times
Fortunately this data also comes from MTA data. We used heatmaps to visualize the best times of foot traffic. As stated earlier, we focused on the traffic entering these stations so it makes sense that the most traffic on these maps is in the evening when people are leaving work. In theory there should be an equal amount during the morning but it is difficult to evaluate this since not everyone exits a station by turnstile.
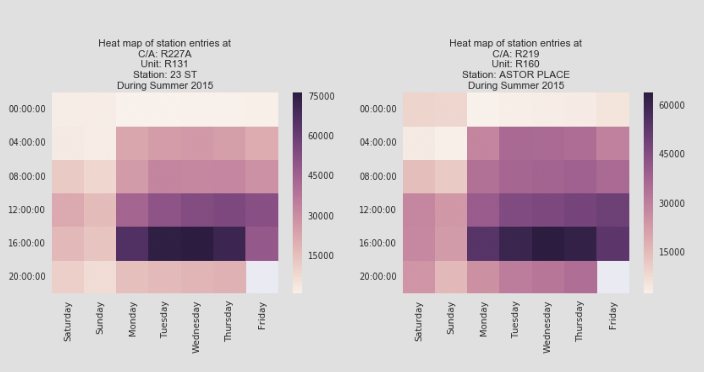
Density of traffic at two different popular subways in tech sectors.
When and where?
We found that the best subways to promote at were the ones with the most tech industry in the zip codes 10010 and 10003 during the evening times on weekdays. It may be also be good to promote earlier in the day though there isn’t enough data to support that. Future studies should investigate the times people are most likely to stop and listen to a promotor. For example, are people less likely to listen to a promotor if they’re on their way to work? The answer could be useful in improving our recommendation.
To learn more about this project check it out on Github or see our presentation.
Subscribe via RSS