Classifying and Predicting Refugee Crises
by Kenneth Myers
It would be an understatement to say that by the third project things got a little disorganized at Metis. The rules for this project weren’t entirely clear. We were told that it was supposed to be a group effort but then it turn out to not be a group project so that come presentation time my group was the only one that stuck together rather than going their own directions (or, as some people did, go it alone entirely).
Unfortunately this wasn’t the best for our project. We chose to model the classification of countries in crisis in order to predict future crises. To break up the project amongst the group, we used a ‘meta-learner’ that involved ensembling the work of the individual group members into a final model (this all being based on a recent paper by the Internal Displacement Monitoring Center). However, there was no control in unifying the codebase in each of our models. Everyone wanted to do it their own way. Now, I understand this, we’re in a bootcamp and here to learn, after all. But, me being a former chemist and the only scientist in the group, it broke my heart to see so much variation in all that we were doing.
Needless to say, I am not proud or ecstatic about this project so for the purposes of this blog I will only be focusing on the work I contributed to the assignment. If you would like to see the work of my other group members you can find links to it at the bottom of this post.
The Data
The first step in the project involved collecting the data. My area of study was the political landscapes and general demographics of countries. I collected my datasources from three locations:
- Transparency International - Keeps track of corruption perception in a country
- Freedom House - gives countries a rating for political rights, civil liberties, and freedom status
- The World Bank - Large database of numerous metrics of countries.
The features I analyzed were as follows:
Political
- Corruption Perception Index1
- Civil Liberties2
- Political Rights2
- Freedom Status2
- Ratio of Female Legislators3
Demographics
- Gender Ratio3
- Population Growth3
- Age<5 Mortality3
- Life Expectancy3
- Population age 0-143
- Population age 15-643
- Population Age 65+3
It was most difficult to find political features and my demographic feature set was somewhat small because I sacrificed some of the features that might have been mine to another student who was analyzing social aspects of countries.
Classifying the data
The World Bank also had data on the movement of refugees from a country. In order to standardize this number, we took each of the refugee populations and divided it by the total population. We then normalized these values and used each countries z-score. Unfortunately, and expectedly, the data was highly skewed because most countries do not have refugee crises. This can be visualized in the plot below.
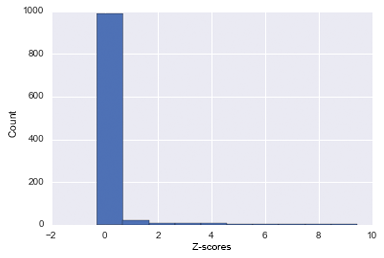
Distribution of country z-scores for refugee population. Note that this data is for the years 2008-2013, hence why the number of countries is so large.
I tried two things to deal with the skewness in the data when cross validating models:
- I oversampled the data using SMOTE (synthetic minority oversampling technique) found in the UnbalancedDataset library.
- I also used stratified shuffle splits to ensure equal ratio of classifiers in training and test splits as what was in the original dataset.
Through both of these and in my testings of various models, I found that K-nearest-neighbors (n=1) was the best model for this data set. Below are the scores for predicting 2013 statuses using data from 2008-2012 without oversampling the data.
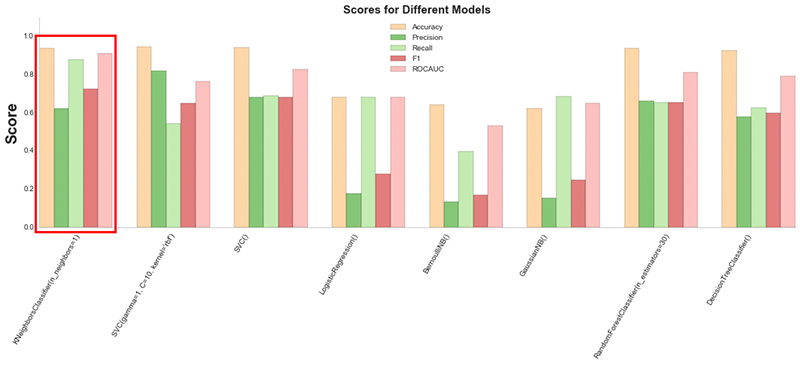
Various scores for predicting statuses of countries in 2013 based on data from 2008-2012. KNN (n=1) was the best model for this data set.
Because the accuracy of the random forest was close to KNN, I used the feature importances from this model to determine a new set of features. My final feature set only included the following:
- Civil Liberties
- Political Rights
- Ratio of Female Legislators
- Gender Ratio
- Population Growth
- Life Expectancy
- Population Age 15-64
Using these features, I ran a final prediction on the 2013 data and obtained the results in the following confusion matrix.
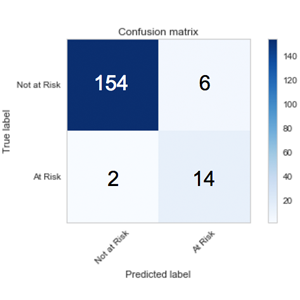
I would have liked better results but overall this is not bad, especially considering it used so few features (it doesn’t include terrorism, crime, natural disasters, resource scarcity, etc.). There were only 6 false positives (precision = 0.700) and 2 false negatives (recall = 0.875). Unfortunately we could not predict on refugee crises in the current year because many of our data sources did not have data for 2014 and 2015 (which is why we had to predict on the year 2013). I did try to make a model that would predict multiple years into the future but the results were very bad (I would only ever get one or two true positives). Perhaps the results from this project can be used when more data is available in the future.
To learn more about this project or see the results of my group members and the meta-learner, check out our Github or see our presentation.
Subscribe via RSS